
IF Filter Measurements on a Yaesu FT-897
When I purchased a 2kHz Collins mechanical IF filter from Inrad (nr. 720F, 455kHz IF) I wanted to know how this filter would stack up against the factory ceramic filter (CFJ455K-14) in the Yaesu FT-897. On the air receiving tests, which is really all that counts, showed me that this filter allows me to "slice off" a signal more easily under crowded band conditions. Especially when utilizing the IF Shift to dig out a weaker signal next to very strong signals becomes the advantage of a narrow filter more obvious. Under light or normal band conditions I actually prefer the ceramic filter since the audio is a bit more pleasant to listen to. These tests made me curious as to what the actual frequency response of the radio is with the ceramic filter and the mechanical filter.
Method
To measure the frequency response of the FT-897 I injected a carrier from a marker generator into the antenna input of the transceiver (tuned in the 20 meter band) and used the radio's VFO to vary the frequency in the USB mode (AGC off). This results in a varying audio tone that can be fed to a computer's soundcard so the amplitude and frequency can be measured by utilizing spectrum analysis software. I used the SpectraPLUS software for these experiments. The spectrum analysis software will then be able to plot a graph indicating the overall frequency response of the receiver. It is important to note that because of the chosen method I measured the frequency response of the complete receiver and not just the IF filters. However, with this method you can determine what the effect of the filters are.
Measurements
The first image shows the frequency response curves of the FT-897 receiver using the factory ceramic filter (CFIL, Red) and the 2kHz mechanical filter (2kHz, pink) from Inrad.
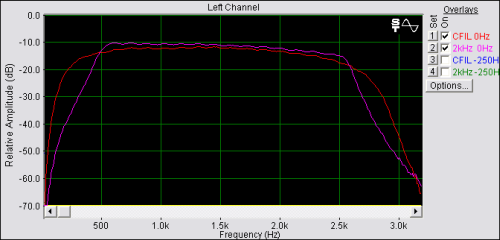
As expected, with the mechanical filter the receiver displays a more narrow response than with the ceramic filter. One might expect the skirts to be somewhat steeper for the mechanical filter, but that is not really the case. When you look more closely to the curve of the mechanical filter, you see that there is a bend in the lower skirt at around -40dB. Also, both curves show a sloping passband. If you'd ignore the slope for just a second, you can see that the passband curve of the receiver with the mechanical filter is flatter than with the ceramic filter. However, the passband curve of the ceramic filter is actually quite flat for a ceramic filter and approaches that of the mechanical filter. From these observations one can conclude that there are other factors at work that influence the frequency response curves.
To eliminate influencing factors outside the radio I have made measurements using the phone output, the external speaker output and the 1200bd data output. I also switched between direct connections and the usual audio path in my shack through a Behringer mixer (no equalization) and high quality isolation transformers that have a flat response. Each and every time the response curves were the same.
To verify the method of measurement, I performed the same measurement on a different transceiver, the Icom IC-718. This radio has only the factory ceramic IF filter installed. The image below shows the frequency response of the IC-718.
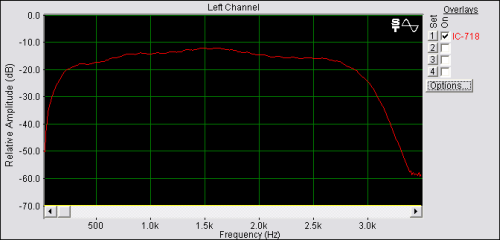
The response curve looks a lot more like what you would expect from a receiver with a ceramic IF filter. The method of measurement seems to be ok for our purposes
The fact that the passband curve is sloping with either filter in the FT-897 and that the passband of with the ceramic filter is quite flat, suggests that there's circuitry, like a secondary AGC loop, in the FT-897 that adjusts the frequency response.
Effect of Changing the Carrier Point
To reduce noise, which consists mainly of higher frequency components, and to improve intelligibility of the audio signal, which is highly subjective of course, it is often suggested to change the receive carrier point. A value of 250Hz is most often mentioned to shift the carrier point. Lets see what the effect is on the frequency response of the FT-897 receiver when we shift the carrier point -250Hz on USB. The image below again shows the response curves for the receiver with the ceramic filter and the mechanical filter.
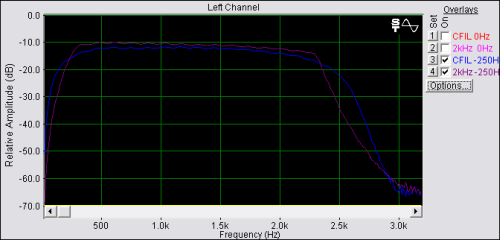
At first glance it looks as if the curves just shifted to the left a bit. When you take a point on the higher skirts of the curve in the top image and compare that to the same point in the last image, then that will appear to be true. But what happens at the lower end? Take for instance the point where the CFIL curve intersects the -20dB line in the top image. If you would shift that point by -250Hz it would actually shift off the chart to some non existant negative frequency. The shape of the lower skirt is actually mostly determined by other components in the receiver and soundcard circuits and not the IF filter.
Remember that -40dB point I mentioned earlier in the first graph of the lower skirt curve of the mechanical filter? When you examine it a bit more closely you'll notice that from -10dB to -40dB the shape of the curve is more characteristic that of a mechanical filter, but below that point the shape changes because other components influence the frequency response more than the IF filter does. In fact the shape of the lower skirt of the mechanical filter curve in the last graph is almost identical to the curve of the ceramic filter. It seems that below about 200Hz (-40dB point) we should not attribute too much of the curve to the way the filter(s) behave.
Conclusion
The frequency response of the FT-897 with just the factory ceramic filter is quite good. It does not show the typical ripple usually found on radios with just a ceramic filter. This is probably due to additional circuitry like maybe a secondary AGC loop or other response determining components. It is easy to imagine that if you would exchange such a filter with a 10-pole mechanical filter that has the same specified bandwidth, you may not hear much difference except maybe under very crowded band conditions. Unfortunately, I do not have such a filter available to do any measurments with.
Exchanging the factory ceramic filter for a narrower mechanical filter will have more of an effect, even if the shape factor of the narrow filter worse than a wider filter. Not only will the audio sound different and will you experience less noise, you will also have a bit more room to play with when using the IF shift to dig out a signal from in between other nearby signals. A wider mechanical filter may be able to slice of some QRM from one side of the desired signal, but it is more prone to pick up QRM on the other side of the desired signal due to its wider passband.
One has to be careful when shifting the carrier point by some arbitrary number (which the often quoted 250Hz is). Shifting the carrier point is like shifting the IF. One may be able to cut off some QRM on one side, but you may add QRM from the adjacent channel on the other side. If you feel you could benefit from shifting the carrier point I would suggest to pick a number that is equal to half the difference in bandwidth specified for the factory installed filter and the optional (mechanical) filter. In this case the factory installed filter is specified as 2.3kHz wide and the Collins filter is specified as 2kHz wide, so a good starting point would be 300/2=150Hz. That way the passband of the optional filter will be centered in the original passband of the factory installed filter. Also keep in mind that when you shift the carrier point, you do this for both filters. The FT-897 does not allow you to specify different carrier points for different filters.
Measurments like these can not really substitute for actual filter measurements whereby you inject a signal into a filter and measure the output directly. From the images and discussion above you can see that other factors than just the filter response may be responsible for the measured curves. Use these methods with caution.
If you have any questions or suggestions, please do not hesitate to drop me an email.
73,
--Alex, KR1ST